1,574 days, 2,408 entries ...
Newsticker, link list, time machine: HOLO.mg/stream logs emerging trajectories in art, science, technology, and culture––every day
“Still, I couldn’t stop tracking. My spreadsheet was the only thing I could control in a life I no longer recognized.”
“The names of various cancer variants and hereditary syndromes flutter across the screen as if from an invisible source, but a few minutes later it doesn’t matter anymore because the universe will end one day.”
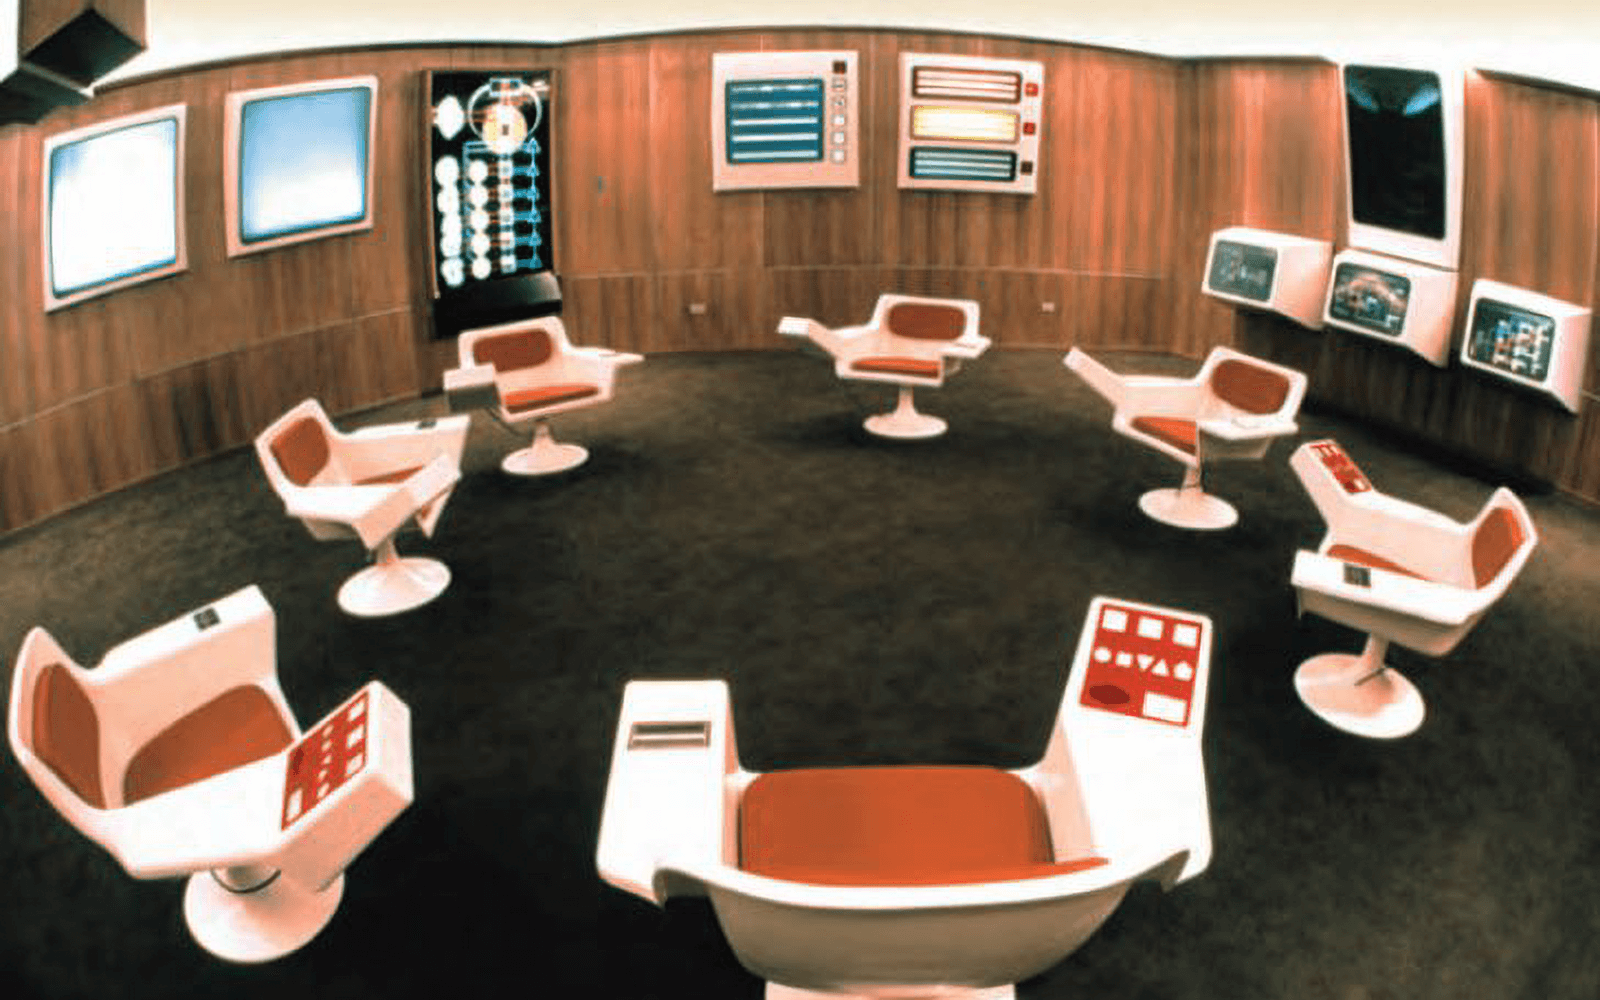
Tech critic Evgeny Morozov launches The Santiago Boys, a podcast chronicling Chile’s Project Cybersyn, the early 1970s fusion of cybernetics with Salvador Allende’s socialist agenda that yielded a technocratic control room (image) that anticipated big data and remains iconic in left-wing thought. Meticulously researched, Morozov tells the story of central consultant Stafford Beer, the CIA-adjacent telco that bankrolled the Pinochet coup, and a forlorn “future where technology helps democracy, not ruins it.”
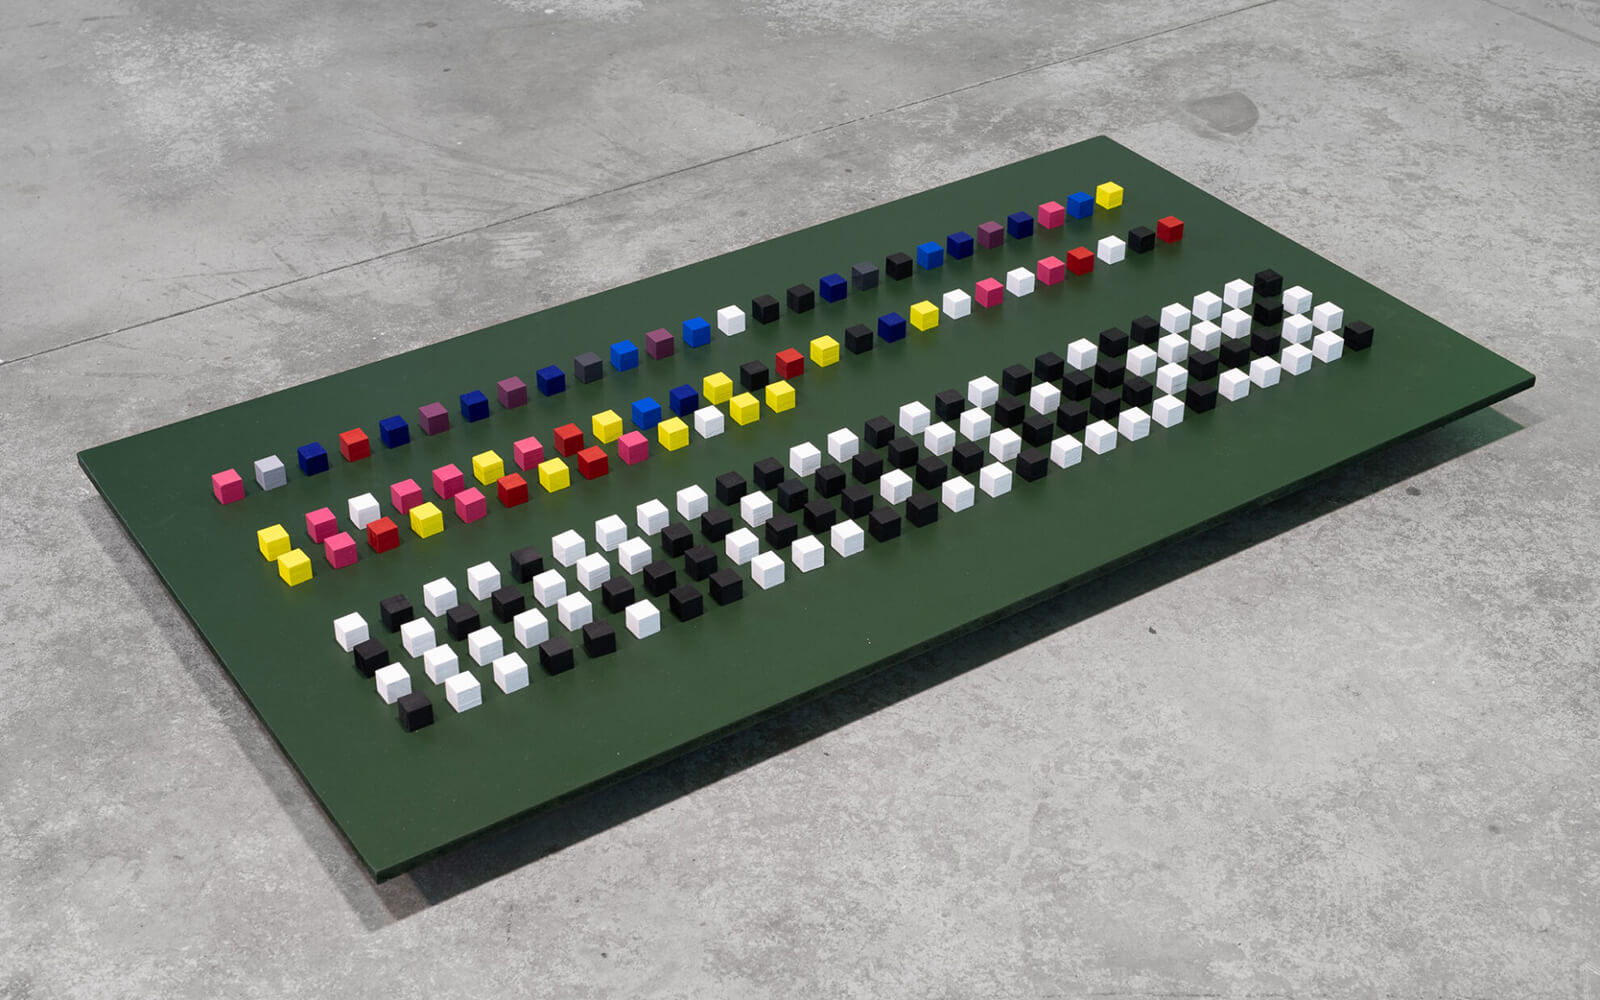
Diving full-on into data aesthetics, Dutch artist (and half of JODI) Joan Heemskerk’s “REc+ >>>” opens at Brussels’ Rectangle (BE). Broadly engaging networks, data, and cryptography, Heemskerk foregrounds the abstraction implicit in computation, in one piece visualizing a mournful requiem for a (crypto) wallet and in another taking the elegant mathematics of base number system conversion (2 to 8 to 16) and expressing it as a sculptural colour study (image: Untitled, 2023).
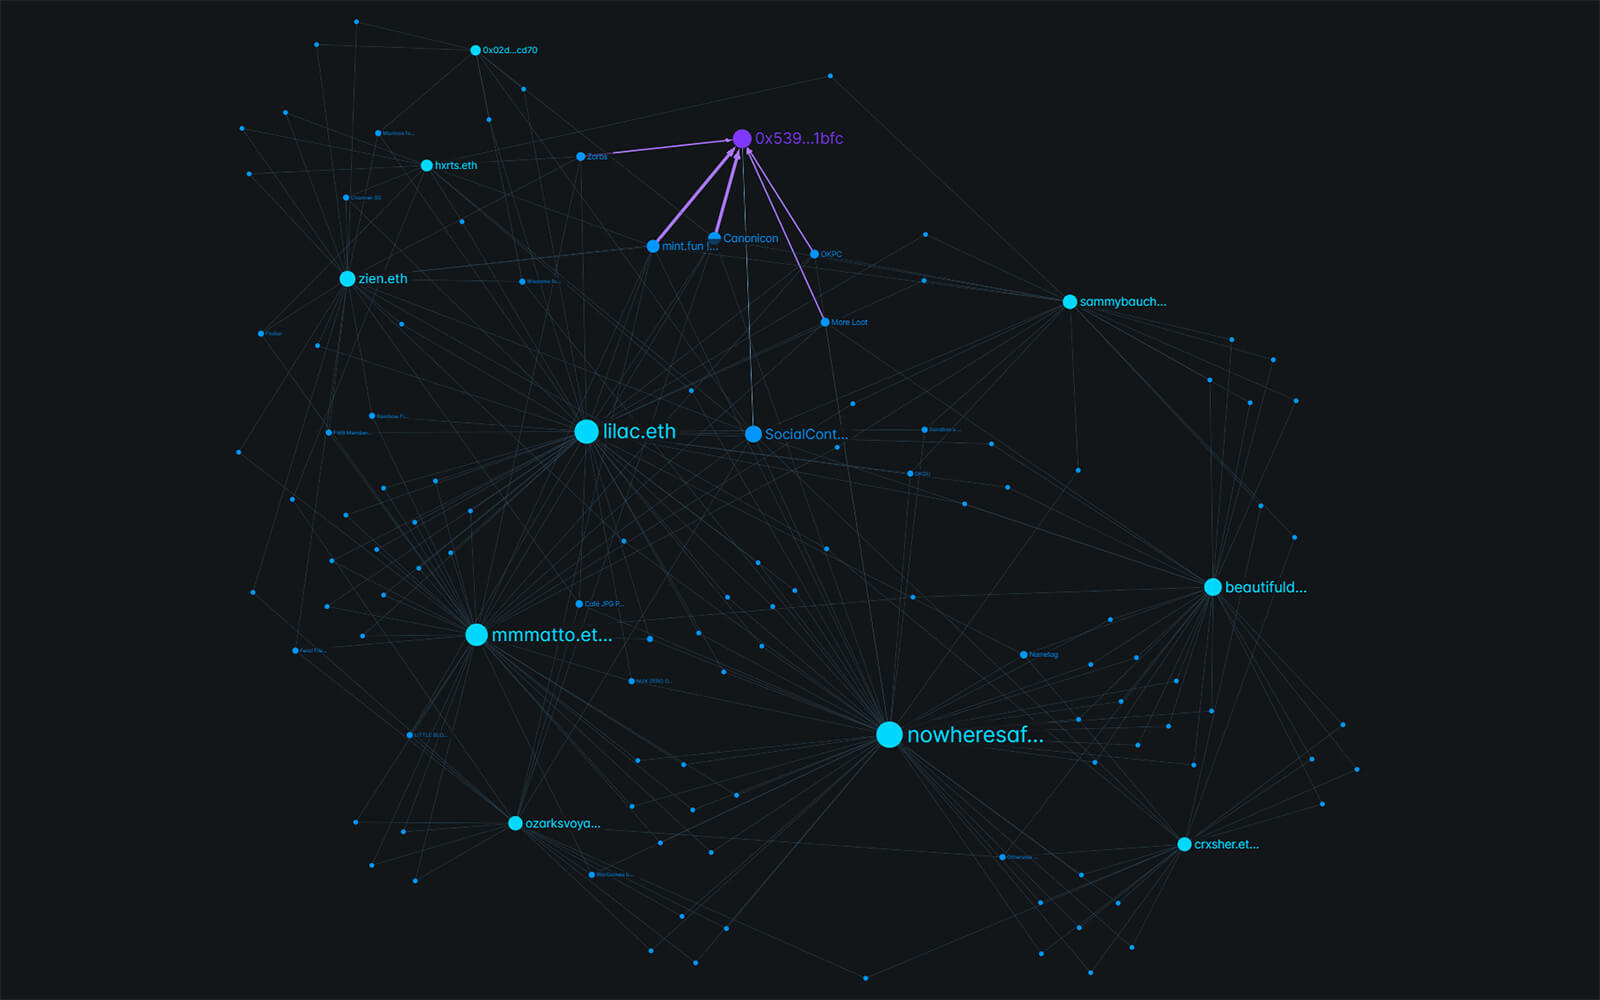
Burak Arikan Maps Power Structures, Financial Flows, and Networks of Influence
The New York-based artist discusses the collector ecosystem revealed by his ‘meta NFT’ Social Contracts (2023) and the evolution of peer-to-peer economies

In anticipation of the UN plastics treaty talks in Paris, Australian researchers at the Minderoo Foundation release the fist-ever plastics pollution weather forecast: Up to 48 kilograms of nylon, polyester, and car tire particles are estimated to blanket greater Paris every 24 hours. Based on 2015 studies rather than real-time data, the actual numbers are likely much higher, the researchers warn. Still, the forecast app “should sharpen the focus of negotiators,” hopes Minderoo’s Marcus Gover.

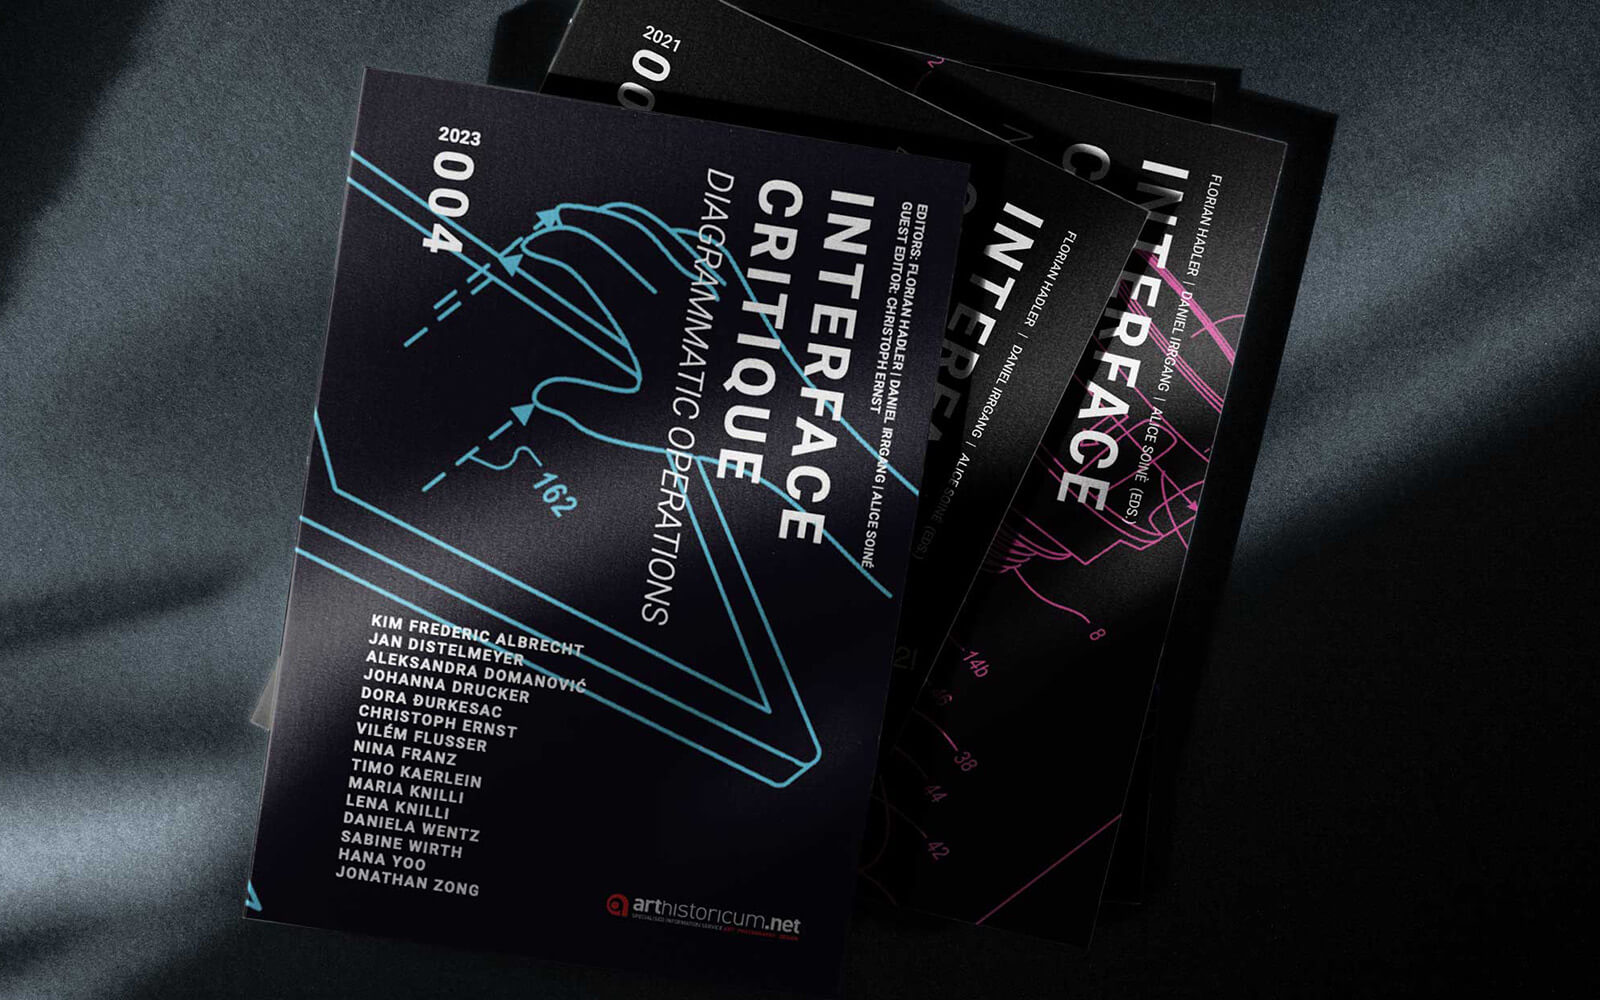
Interface Critique 4
Diagrammatic Operations
The public mint for Social Contracts, an Ethereum wallet network visualization by Turkish artist Burak Arikan closes. In all, 899 editions were minted by NFT collectors who were curious to see what their purchase history reveals about their nearest neighbours on the blockchain. Built by Arikan using his Graph Commons platform, the token visualizes connections between the owner and other collectors, predicts future NFT acquisitions, and evolves with each purchase and transfer of ownership.
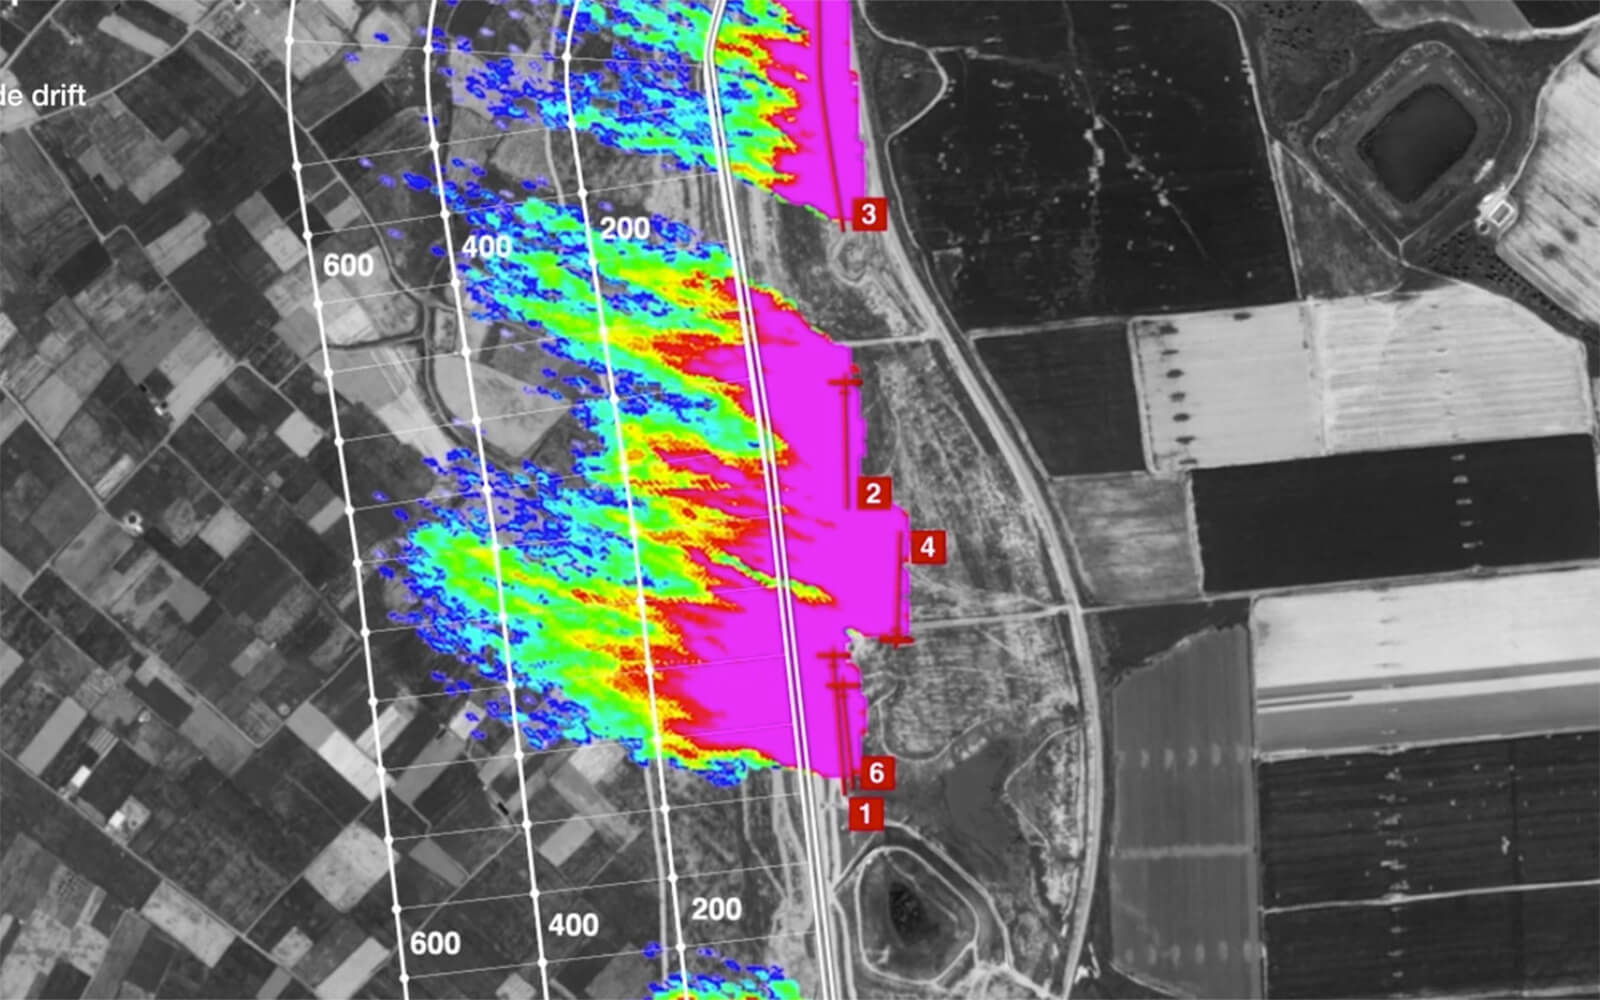
Counting 3,158 submissions “despite a pandemic and a temporary shutdown of the art world,” Ars Electronica announces the winners of this year’s Prix Awards. Golden Nicas go to Forensic Architecture’s airborne violence analysis Cloud Studies (image), Alexander Schubert’s AI ensemble Convergence, and Guangli Liu’s When the Sea Sends Forth a Forest, a CGI lesson in Cambodian “lost history” under Khmer Rouge rule. In addition to the three main prizes, the jury also granted six awards of distinction and 36 honorary mentions.
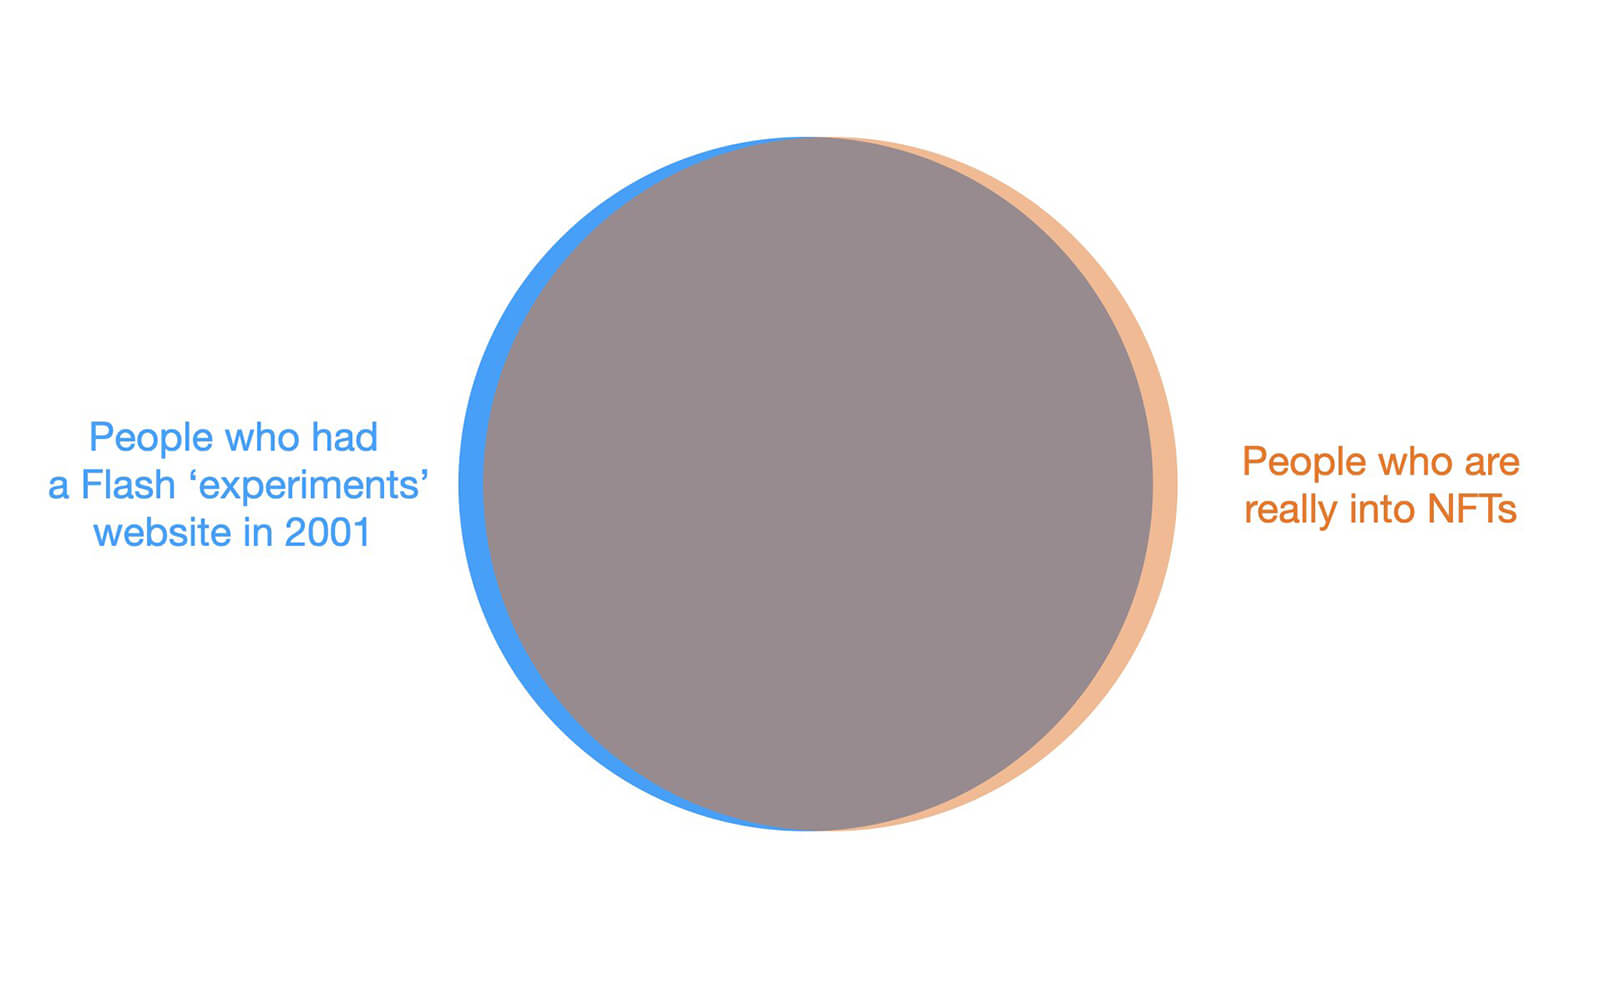
Known for translating complex cultural matter into tantalizing visualizations, data artist Jer Thorp shares a tongue-in-cheek Venn diagram that suggests a strong correlation between early Flash euphoria and the current NFT boom. Thorp also provides a data point for exceptions to the rule: “I had a Flash ‘experiments’ website in 2001,“ he disclaims on Twitter, ”and I am not really into NFTs.”
“This is 22,935 birds, counted in Brooklyn in 2001 by intrepid birders for NYC Audubon.”

Daily discoveries at the nexus of art, science, technology, and culture: Get full access by becoming a HOLO Reader!
- Perspective: research, long-form analysis, and critical commentary
- Encounters: in-depth artist profiles and studio visits of pioneers and key innovators
- Stream: a timeline and news archive with 1,200+ entries and counting
- Edition: HOLO’s annual collector’s edition that captures the calendar year in print